Background Information
In early 2015 a proposal was made to the Executive Board to begin building a new website for St. Sava Church in Merrillville, Indiana. For several years St. Sava had maintained a blog-style website, but when the system that hosted the old website was no longer available in 2014, a new website and way of communicating became necessary.
The new website went online in late May 2015 and while this new St. Sava website is still going though some development with content, one of the early primary goals of the new website was to continue in the spirit of the old website, sharing stories about the activities and events that take place involving St. Sava and it’s parishioners.
For the last six months, approximately 180 days, there have been about 100 articles of news and information posted in the Blog section of the new St. Sava website (www.saintsava.net/blog) in a style that is similar to the previous blog-style website that existed before.
Since the launch of the website over the last six month period (June 1 through November 30, 2015), a first glimpse into some of the usage numbers behind the website helps to explain how the website is working so far and offers some insights that could be helpful for how the website will continue to evolve in the future. Such analytics help us to understand various aspects of the website, including the most popular pages of the website, the numbers of people who visit the website, and some general demographics of the people who are using it.
Initial Website Statistical Data
General statistics
Over the last six months:
- 8,562 people visited the new St. Sava website.
- 26,332 pages on the new St. Sava website have been viewed.
- On average, people click and visit at least 2 webpages of the new St. Sava website each time they visit.
- 33% of all people visiting the new St. Sava website arrive to the website from a link they clicked within Facebook.
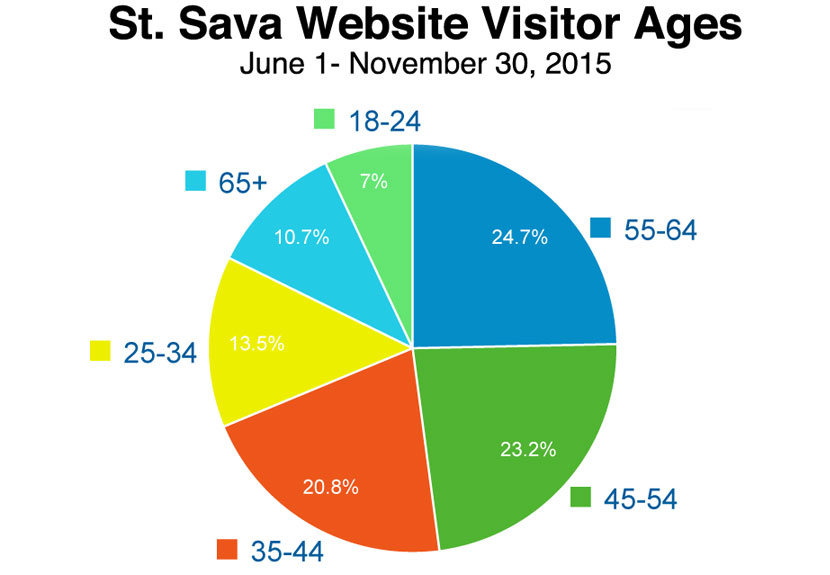
User age groups from largest to smallest
In the last six months:
- Ages 55-64 compose 24.68% of visitors
- Ages 45-54 compose 23.22% of visitors
- Ages 35-44 compose 20.84% of visitors
- Ages 25-34 compose 13.54% of visitors
- Ages 65+ compose 10.72% of visitors
- Ages 18-24 compose 7.00% of visitors
One of the interesting pieces of demographic information discovered in the website analytics involves the age ranges of the people who are currently using the new St. Sava website. Frequently it seems people tend to imagine that only “young” people are engaged with technology or at the very least, people in the youngest age groups tend to use technology the most.
Interestingly though over the last six months, data shows that people age 55-65+ compose more than 35% of the people who use the new St. Sava website. People in the age range of 18-34 compose barely more than 20% of all the people who use the new St. Sava website.
Among people who have used the St. Sava website over the last six months, it is clear at this time people in the youngest age range of 18-24 tend to use the new St. Sava website the least.
What Does This All Mean?
Understanding the trends in website usage over time provides insights into how the St. Sava website and contents may be refined in the future to better meet the needs of the parishioners and people who use the website.
For example, the data indicates that people in the 55-64 age range use the website the most. Considering people in this age range are among those who use the website the most, it could be valuable to survey people in this population to develop a better understanding of why the are visiting the website. It is important to find out the kinds of information people in this age range value so that such information may continue to be produced and placed on the website in the future.
Data also suggests that people in the age range 18-24 use the website the least. Knowing this helps illustrate that it will be important to engage young people in the 18-24 age range to get a better understanding of the kinds of information they find valuable so that content can be developed to increase their interaction with the information on the website, thus increasing their engagement with St. Sava Church.
There are many ways to interpret the analytic data over the last six months of the new website usage. It is important to note though, analytic data is sometimes based upon estimations which means none of the numbers generated though analytics are absolute. However the trends over time, such as those over the last six months, do help to tell a bit of an initial story. It will be important to continue examining these trends over long periods of time to gain insights about how people are using the website to help St. Sava Church identify ways to refine communication with the diverse populations of parishioners and other constituents to improve connections among people and the church.
St. Sava Church uses Google Analytics to learn about how users interact with the website. No personally identifiable information is ever collected. Learn more information about Google Analytics Data Privacy and Security.